 Reservoir
The reserve, and every reason for it.
Reserving software for property and casualty actuaries. Every figure traces back to its source, and every change is on the record.
Reservoir
Reserving software for property and casualty actuaries. Every figure traces back to its source, and every change is on the record.
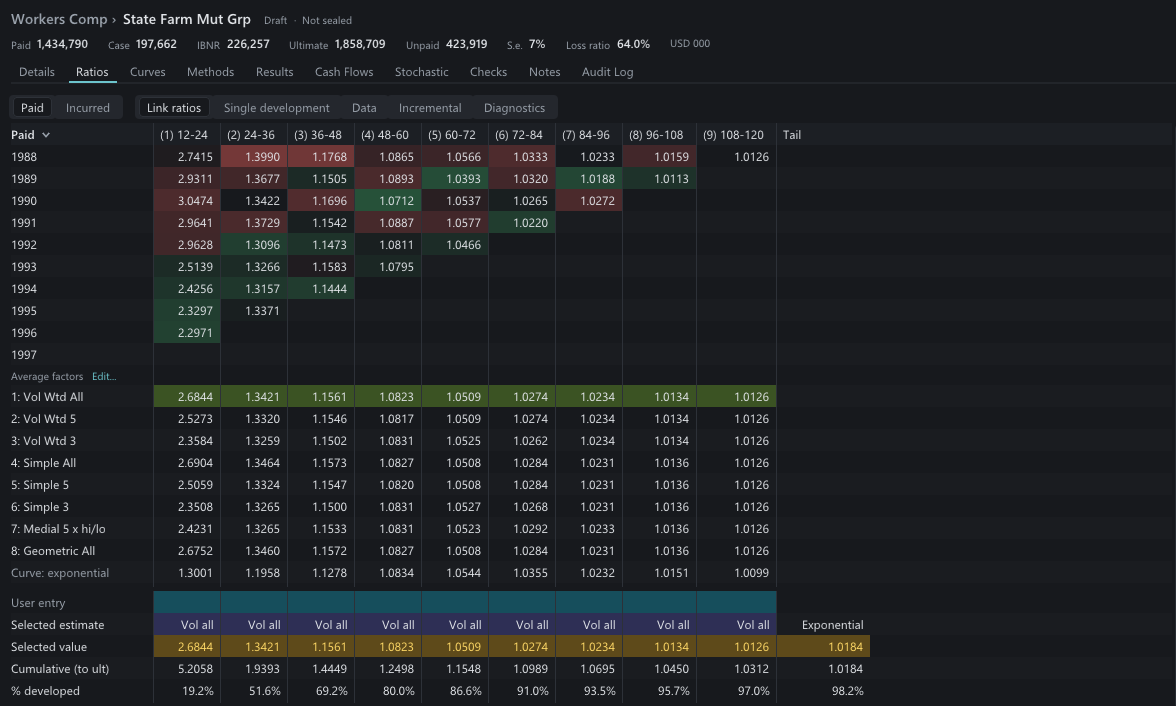
Select a figure and press Ctrl+[. Reservoir walks it back to the method, the factors and the cells it came from.
Below, Reservoir’s own trace of one cell. Public CAS Schedule P data; State Farm Mut Grp is a dataset name, not a client.
135,525
Selected ultimate, workers compensation, accident year 1997
Before asking you to trust its numbers, Reservoir reproduces the published ones.
| Published result | Paper | Reservoir |
|---|---|---|
| Chain-ladder IBNR, RAA data Mack (1994) | 52,135 | 52,135 |
| Mack standard error, RAA Mack (1994) | 26,909 | 26,909 |
| Chain-ladder reserve, Taylor–Ashe Mack (1993) | 18,680,856 | 18,680,856 |
| Mack standard error, Taylor–Ashe Mack (1993) | 2,447,095 | 2,447,095 |
| ODP prediction error, RAA England & Verrall (2002) | 18,193 | 18,195 |
| One-year CDR, root MSEP Merz & Wüthrich (2008) | 81,080 | 81,081 |
| LDF method, Weibull reserve Clark (2003) | 21,214,761 | 21,214,728 |
Rounded as the papers print them. The ODP difference is the paper’s iterative fit against an exact one; the Clark difference is where two maximum-likelihood searches stop, 0.0002% apart. Merz–Wüthrich and Clark use their papers’ own data.
Tested against the published worked examples where they exist. Triangles or claim-level data from CSV, Excel or Google Sheets; IFRS 17 and Solvency II outputs; an Excel add-in.
Built for the reviewer, the auditor and the regulator who will ask how the number was reached.
Reservoir is built to feed pricing and capital. Tributary and Highwater, in development, run on the same engine and the same set of assumptions.
The browser trial runs on your computer; data you upload never leaves it. Or book thirty minutes and we will take you through it on our data or yours.